


Unpacking the U.S. Census Data on 'Natural Disasters' Part II: Damage & Impacts
Top line numbers on damage levels and challenging experiences post-disaster

In Part I of this series I described the U.S. Census Household Pulse Survey and its Phase 3.7 questions on ‘natural disasters’ and summarized some of the key national findings re: displacement. This next part centers on the second set of questions regarding a) the amount of damage to the respondents’ property and possessions from disaster and b) experiences like food and water shortages, loss of electricity and feelings of being isolated or scammed.
Level of Damage
In Part I we described the national dataset as reporting that 3.33 million Americans reported having been displaced by a disaster in the past 12 months. What level of damage did these households suffer?
Another bullet point aside on survey methodology…the questionnaire first asks about being displaced by a disaster, then later asks “Altogether, how much damage to your property or possessions did you experience as a result of natural disasters in the last year?” In my reading these would be separate questions, i.e. it is entirely possible to suffer damage from a ‘natural disaster’ but not be displaced. And yet, the population responding to the length of displacement questions is the same as the number responding to the amount of damage to property and possessions questions. This implies that being presented with damage questions was dependent on an affirmative response to the displacement question. Again, I would love to speak to someone involved in the Household Pulse Survey effort to confirm.

As you can see, the number of households reporting moderate or ‘a lot’ of damage was significant - about 44% of respondents. Those reporting some or no damage were slightly larger, however, at 53%.
Post-Disaster Experiences
The next question asks respondents who replied affirmatively to the earlier ‘natural disaster’ questions whether they experienced any of the following in the first month following:
A shortage of food?
A shortage of drinking water?
Loss of electricity?
Unsanitary conditions?
Feeling isolated?
Fear of crime?
Offers that seemed like a scam?
For each experience, the questionnaire then asked the respondent whether they had that experience:
Not at all
A little
Some
A lot
Similar to the damage question above, the questionnaire left it to the respondent to define what these categories meant.
Let’s look at the results. Remember, across all of these questions the population responding is the 3.33 million who reported having been displaced by a disaster.

The good news here is that the majority of respondents did not experience a shortage of food, or only a little. However, 36% of respondents did report experiencing some (17%) or a lot (19%) of a shortage.

The water numbers are better still, with 66% reporting that they did not experience a shortage of water or only a little. However, 31% did experience some (16%) or a lot (15%).
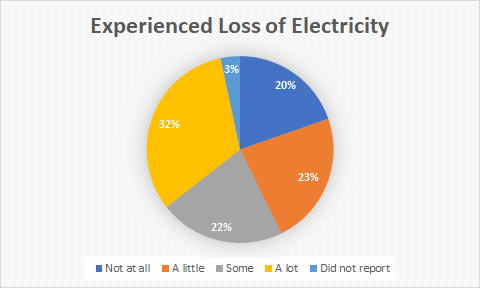
As we would expect, a significant amount more respondents experienced a loss of electricity in the month after disaster(s).

Luckily, a solid minority of respondents experienced some kind of unsanitary conditions, with about 14% saying they experienced those conditions ‘a lot.’ I would really like to hear more about these conditions - what would be included? Are these nuisance conditions or something more serious that presents serious public health risks?

Helpfully, the Household Pulse Survey then asks a series of questions that speak to the mental health consequences of disasters. For example, 40% of respondents reported feeling ‘a lot’ or ‘some’ feelings of isolation in the month after the disaster.

Similarly, 38% of respondents said they experiened ‘a lot’ or ‘some’ fear of crime.

Lastly, nearly half (47%) of respondents said they experienced possible scam offers in the month following the disaster, which speaks to the widespread and pervasive issue of post-disaster fraud in the United States.
Concluding thoughts and part III
These data provide interesting insights into the national-level experience of disater and the immediate aftermath. In part III I will break some of these numbers down along socio-demographic and geographic lines, to see if we can tease out any significant trends or points of departure that speak to the differential experience of disasters.